SDS-Gel Electrophoresis of Milk
What is SDS-Gel Electrophoresis?
|
SDS-gel electrophoresis is a technique by which the relative mobility of proteins can be determined by comparison to a standard ladder. SDS, or sodium dodecyl sulfate, is a detergent used to linearize proteins, coating the molecules in a uniform negative charge and allowing for migration dependent only upon size during electrophoresis. Subsequent staining with Coomassie blue solution provides clear visualization of protein bands on the gel.
|
Purpose of Experiment:
To perform portions of the SDS-PAGE method to measure the relative mobility of standard proteins, construct a plot of log Mw vs. relative mobility, and determine the molecular weight of unknown proteins.
Procedure:
Two samples each of casein and milk were weighed out on an analytical balance, then diluted in water to a concentration of 4 ug protein/uL. Laemmli sample buffer (containing B-mercaptoethanol) was then used to dilute the samples to 2 ug protein/uL. The 1.5 mL tubes containing the samples were then boiled for 5 minutes before loading. 20 uL of each sample was then loaded one by one into the precast wells of two 12% mini-polyacrylamide gels using the Gilson pipetman. 20 uL BioRad unstained and Kaleidoscope protein standards were loaded for comparison. Clean pipet tips were used for each sample to avoid cross contamination. After all samples were loaded, running buffer was poured into the electrophoretic chamber and the power supply was turned on. The gels were run at a voltage of 100-150 V for approximately 50 minutes, then transferred to incubate in a tray of Coomassie staining solution for 30 minutes. (The gels would have then been placed in a destain solution for 30-60 minutes before analysis.)
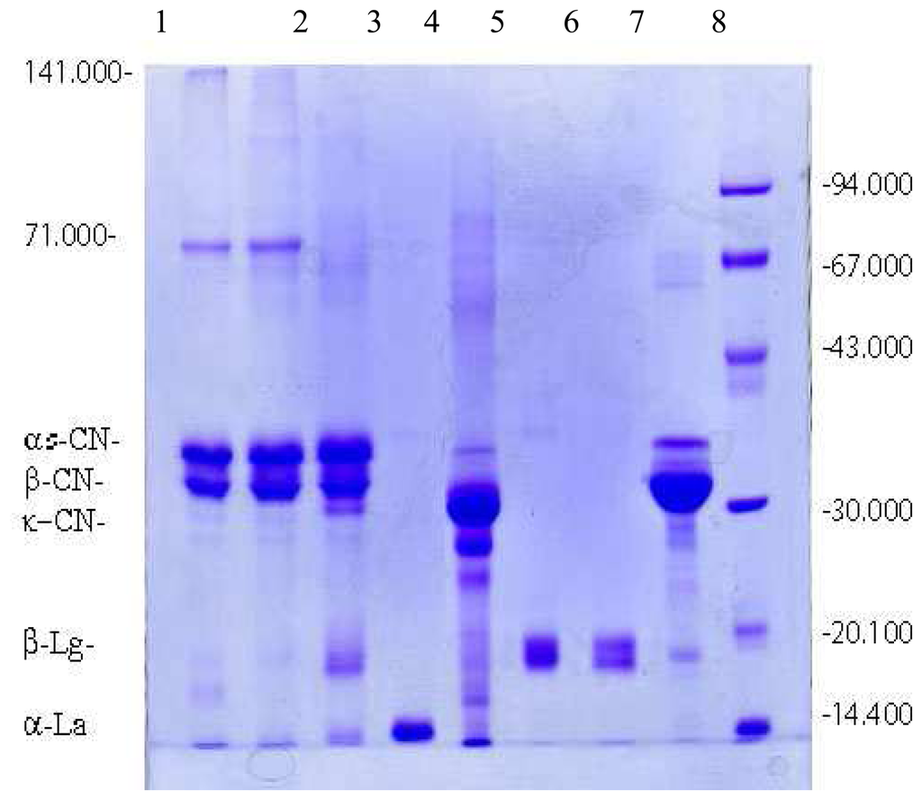
Results:
The gels were kept in the Coomassie stain for too long a period; bands were not visible and results could not be interpreted.
Conclusion/ Improvements:
According to the BioRad markers, had the gel been properly run and stained, the band for casein would have been seen at approximately 22-26 kDa (just around the pink marker towards the bottom of the Kaleidoscope standard), and the milk would have produced bands at approximately 22-26 kDa (casein) and 14 kDa and 18 kDa for alpha and beta whey proteins, respectively. The whey proteins would have migrated slightly further on the gel than the casein due to their smaller size and faster rate of migration in relation to the casein protein.
