HPLC Analysis of Ascorbic Acid
What is chromatography?
What is column chromatography?
What is HPLC?

|
Chromatography is a technique that allows one to separate materials based on partitioning of a solute between a mobile and stationary phase. By taking advantage of the chemical properties of the solute of interest (i.e. polarity, size, etc.) we can isolate the components of a mixture.
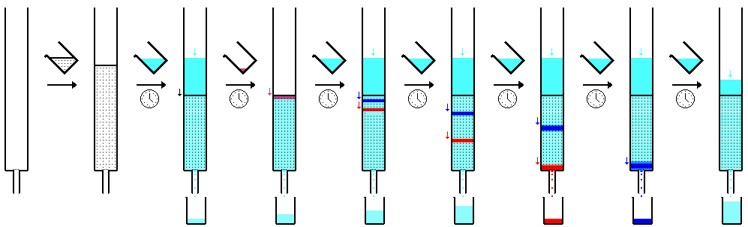
Column chromatography is a chromatography technique that uses a packed column as the stationary phase and the liquid mixture as the mobile phase. The mobile phase is put at the top of the column and is allowed to migrate through the column (stationary phase). Over time, components of the liquid mobile phase will separate out into bands and will thus elute from the column at different times. Each component of the mobile phase has a signature retention time which allows for identification of components. In general though, large components will have greater affinity to the column and will have a longer elution time, whereas smaller components have less affinity for the column and will have a shorter elution times.
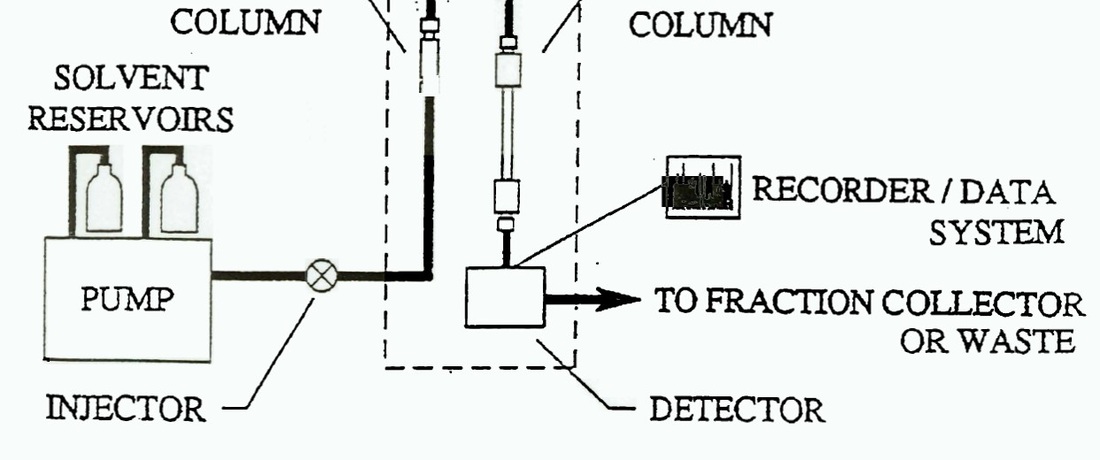
HPLC (High Performance Liquid Chromatography) is a chromatography technique that optimizes the simpler column chromatography method. HPLC is different because the liquid mixture mobile phase is pumped through small diameter tubing that highly pressurizes it. In the picture, a solvent reservoir (not containing the analyte) will first be pressurized through the pump apparatus. The analyte (liquid mixture of interest) will then be added to the pressurized solvent stream via the injector, where external material can be added to the mobile phase. The mobile phase is then put through the analytical column (stationary phase). As the mobile phase separates, the detector quantifies the quantity and retention time and is printed in a readout via the recorder/data system. A typical readout from an HPLC is shown to the left. Each peak signifies a different component and the area under each peak signifies the quantity of that component. Finally, the mobile phase is then collected by the fraction collector. Click here for a video summarizing the process!
|
Purpose of Experiment:
Procedure:
|
To use reverse phase high performance liquid chromatography (HPLC) to determine the amount of ascorbic acid in three different orange juice samples (chilled, room temperature, and heated). We want to see if juice preparation affects ascorbic acid concentration.
|
HPLC requires the preparation of standard dilutions to construct a linear standard curve. These standards help us determine the quantity of each component by associating a specific area under the curve with a specific, known amount of substance. After the standards were prepared and measured, the Minute Maid juice samples were prepared for input into the HPLC machine. The juice samples, after preparation in chilled, warm, and room temperature conditions, were first centrifuged. The supernatant was then put through filtration in a Sep-Pak cartridge. The eluate of the filtration was collected and put through a Millipore filter. This final filtrate was the sample that was used to perform HPLC. The samples were put through HPLC and the apparatus gave us a read out with peaks signifying the different components of the orange juice. The standards were used to quantify the amount of ascorbic acid based on the peak area of ascorbic acid.
Results:
Below is the readout we obtained from the HPLC for one of our samples:

The peak for ascorbic acid had a retention time of around 1.93 minutes. In the readout from the HPLC, the peak closest to this time was identified as the ascorbic acid peak. The peak area given in the readout was then used in a ratio with the standard concentrations and standard peak areas to get a concentration of ascorbic acid. Due to time restraints, we used data from one group. Below are tables describing our results for the standards and different preparations of juices:

With the measurement of the standards, we were able to construct a standard curve, shown below:

To quantify the ascorbic acid in our prepared juice samples, we used two methods:
1. Set up a ratio using the standard concentration and standard peak area and putting it equal to an unknown concentration, but known ascorbic acid peak area. We used the 0.05mg/mL standard in our calculations.
2. Use the equation of the standard curve to solve for concentration and inputting a peak area value.
We used the average peak area obtained from the two trials of each juice sample. Below are the ascorbic acid concentrations we calculated for each sample:
Ascorbic Acid Concentration for Room Temp Juice: 0.208 mg/mL
Ascorbic Acid Concentration for Chilled Juice: 0.208 mg/mL
Ascorbic Acid Concentration for Warm Juice: 0.263 mg/mL

Discussion/ Improvements:
With these results, we had to compare our calculated ascorbic acid concentrations for each treatment to the ascorbic acid concentration that was given in the Minute Maid from Concentrate nutrition label.
Assuming we used the same Minute Made from Concentrate as our spectrophotometric determination of ascorbic acid, we have ascorbic acid concentrations of:
96 mg / 355 mL = 0.270 mg/mL (the concentration of Vit C in the canned concentrate)
96 mg / 1417 mL = 0.0677 mg/mL (the concentration of Vit C in each juice sample)
Similar to our results for the spectrophotometric determination of Vitamin C in orange juice, our experimental results were a lot larger than the claimed 0.0677 mg/mL we calculated from the nutrition label. Between experimental treatments, we also see slight differences in Vitamin C concentrations. No conclusions can be made, however, due to the varying results obtained from each mathematical method of determining Vitamin C concentration. In our ratio method, we see a trend similar to the spectrophotometric determination of Vitamin C, with the chilled sample having less Vit C than the room temperature control and the warm sample having more Vit C than the room temperature control. This changes, however, when we look at the standard curve calculation. We see from these calculations that the chilled sample has more Vit C than the room temperature control and the warm sample has more Vit C than both the chilled sample and room temperature control. Even when we take the average of the two methods, we do not see a distinct trend. We can attribute this to the nature of the standards—the standard curve, although it should be close to linear, ended up looking more exponential and may have thrown our values off.
