Protein Analysis
What is Spectrophotometry? |
The quantitative measurement of the light absorption of the compound
|
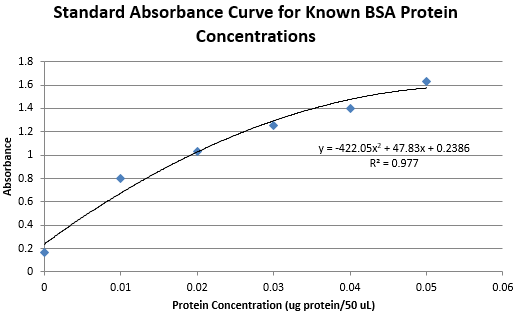
Purpose of Experiment:
|
To determine the protein content of a sample through the construction of a standard BSA absorbance curve
|
Procedures:
Weigh about 90 g of meat and blend it with 270 mL extraction buffer for 1 minute.
Pour 30 mL of the mixture into two 50 mL centrifuge tubes.
Centrifuge the tubes at 2000 x g for 15 minutes at room temperature.
Wet the filter paper on a funnel with extraction buffer.
Filter the supernatant using filter paper in a funnel.
Prepare the dilution accordingly to the table.
Vortex all mixtures.
Incubate in water bath at 37°C for 30 minutes.
Read the absorbance at 562 nm with spectrophotometer.
Results:
Protein Concentration for Bologna Sample using 1:5 Dilution: .0629 ug/mL
Protein Concentration for Turkey Sample using 1:10 Dilution: .0708 ug/mL
Protein Concentration for Turkey Sample using 1:10 Dilution: .0708 ug/mL
Observations:
We have noticed that our sample, german bologna contained a lot more fat than we expected (based on the mouth-feel in cooked foods). It is so because bologna is typically uncooked, but rather served like hotdogs - ready to eat processed meat. We asked if additional fat is added during processing, and surprisingly it is. During the protein extraction, meat had characteristic smell, but eventually smelled like a tuna fish. It could be either that our olfactory weakened, or just that tuna fish has strong odor.
Calculations:
We had to convert the BSA concentration to units of µg/µL to use as the protein concentration in our curve:
1 mg/mL BSA * (1 mL/106 µL) * (1000 µg/1 mg) = .001 µg/µL of BSA
We used the trendline to calculate a protein concentration using the absorbance we measured for our meat samples:
y = -422.05x^2 + 47.83x + 0.2386
Bologna 1:5 Dilution (Dilution Factor = 5)
Absorbance: y = 0.2685
0.2685 = -422.05x^2 + 47.83x + 0.2386
We used the quadratic formula on my calculator to get an “x” value:
x = 6.29 * 10^-4 µg/ 50 µL
Convert to µg/mL:
6.29 x 10^-4 µg/ 50 µL x (10^3 µL /1 mL) = .01258 µg/mL
Correcting for dilution: .01258 µg/mL x 5 = .0629 µg/mL
This means we had .0629 µg of protein per mL of extract.
Turkey 1:10 Dilution (Dilution Factor = 10)
Absorbance: y = 0.2555
0.2555 = -422.05x^2 + 47.83x + 0.2386
We used the quadratic formula on my calculator to get an “x” value:
x = 3.54 x 10^-4 µg/ 50 µL
Convert to µg/mL:
5.86 x 10⁻⁴ µg/ 50 µL x (10^3 µL /1 mL) = .00708 µg/mL
Correcting for dilution: .00708 µg/mL x 10 = .0708 µg/mL
This means we had .0708 µg of protein per mL of extract.
Discussion/ Improvements:
The protein content calculated using the equation derived from the standard curve yielded negative numbers. When we were working on the powerpoint for the presentation, they initially used the standard curve, which gave the higher r^2 value and got the positive numbers. With all my calculations being correct, negative protein content is not possible. I would like to try again (if I could) with my dried food sample. The fact that our group spent considerable amount of time in the lab, but got the ludicrous results made me sad.
